
In this month’s installment of the “Bioprocess and Bioanalytics” blog, we will hear from Drs. Robin Turner and James Piret on how an established spectroscopy method – Raman spectroscopy – can be utilized to tell us new information about cell therapy products. Both are Professors in the Michael Smith Laboratories at the University of British Columbia. Dr. Robin Turner has a cross appointment in the Department of Electrical and Computer Engineering and Dr. James Piret is in the Department of Chemical and Biological Engineering.
Suppose you wanted to assess the phenotypic uniformity of a manufactured lot of therapeutic cells, as well as the consistency of that lot compared to previous ones, and you need the result within an hour. Further, suppose that you want to avoid using any reagents (stains, molecular probes) as the assessment should be non-perturbing to the cells. What analytical method would you choose? If you answered “Raman spectroscopy,” then you probably already know most of what you might learn from the rest of this blog. If you could not propose a method, but are interested in addressing this problem, then you should read on.
What is Raman spectroscopy and what can it tell me?
Raman spectroscopy (RS) is the analysis of inelastically scattered light that has exchanged energy with a molecule (or system of molecules). This is a rare event that occurs for a very small fraction of the incident light. However, that fraction of Raman scattered light is highly information rich. This is because the interactions involve specific molecular vibrational modes of the system that are characteristic of their chemical structure and bonding configurations. Most interactions involve a transfer of energy such that the scattered light is shifted to a lower energy (i.e. longer wavelength). The intensity of the scattered light as a function of the energy shift – a Raman spectrum – exhibits features that, collectively, provide a “fingerprint” that reveals the predominant chemical composition and microenvironment of the sample.
Over the past 20 years or so, RS probes have been developed that are mainly used to estimate glucose concentrations in the medium to control nutrient feeding during the manufacture of protein therapeutics. Only recently have methods based on RS been developed to analyze macromolecular changes in the actual cultured cells. For example, we have focused on differentiating cells (Fig. 1).
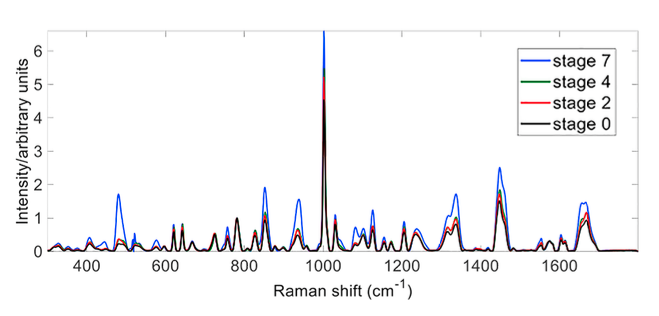
Fig. 1. Four overlaid Raman spectra measured from a multi-stage directed differentiation from stage 0 embryonic stem cells to stage 7 maturing beta cells. The Raman shift is conventionally expressed in wavenumbers (cm–1) that are directly proportional to the energy (frequency) of the related molecular vibrations.
Evident in Fig. 1 are clear changes in the intensities of several bands that distinguish different stages of the process, as defined in Rezania et al. (Nature Biotechnology). Appropriately characterized, the Raman spectrum contains sufficient information to measure chemical changes in cells as they grow and thereby monitor their differentiation state during bioprocessing. In many cases, such information is readily obtained directly from the relative intensities of specific bands/peaks that are dominated by contributions from the predominant cellular macromolecules.
Significant deviations from the characteristic spectra can reveal the emergence of undesirable sub-populations or changes in viability to serve as complementary and orthogonal process quality control analytics. This would augment relatively infrequent (e.g. daily or weekly) conventional cell analysis of transcription factors and cell surface markers based on off-line mRNA and flow cytometry assays. In some cases, multivariate chemometric methods (e.g. Principal Component Analysis, Linear Discriminant Analysis, 2-D Correlation spectroscopy, etc.) that take into account statistical variations across the full spectrum are employed to extract more subtle correlations. All of these methods can be used to establish design/knowledge space parameters that define permissible quality control boundaries (Konorov et al., Anal. Chem., 2015).
There are many practical attributes that make RS a promising process analytical technology. For starters, it can be performed nondestructively on live cells and is amenable to automated operation.
There are many different types of RS (e.g. linear spontaneous RS, surface-enhanced RS, resonance-enhanced RS and coherent stimulated RS), each with certain advantages. All can be implemented in a variety of different ways and tailored for particular applications. For example, spontaneous RS is often coupled with light microscopy so that spatially resolved “chemical images” (with sub-cellular resolution, if desired) can be rendered using molecular vibrations as the contrast mechanism. By raster scanning the excitation & collection over the region of interest, a full spectrum is captured at each pixel, so any peak intensity or peak ratio can be used to render an image as shown in Fig. 2.
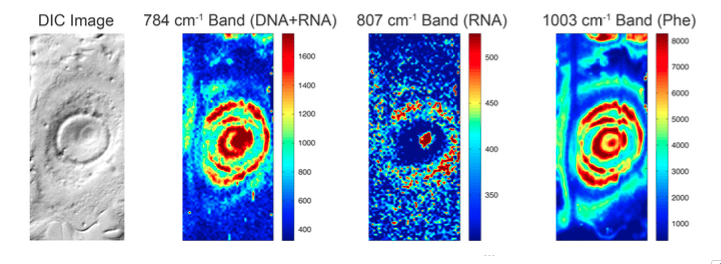
Fig.2. Example of chemical images of an MCF-7 cell false-coloured to show the predominant spatial distribution of nucleic acid, RNA and protein based on the vibrational bands indicated in the figures; the image on the left is by differential interference contrast (DIC).
We hope you are starting to appreciate the versatility and utility of RS for monitoring cultured cells. You may be wondering: why then is this powerful technique not already in routine use throughout this industry? You may also be wondering what it would cost and what equipment or other resources are needed. We will address these questions in Part 2 of this post.
Sowmya Viswanathan
Latest posts by Sowmya Viswanathan (see all)
- Raman spectroscopy for monitoring therapeutic cell manufacturing – Part 2 - March 28, 2019
- Without new funding, key part of Canada’s stem cell research ecosystem to close - February 28, 2019
- Raman spectroscopy for monitoring therapeutic cell manufacturing – Part 1 - September 6, 2018


Comments